Our analysis identifies both positive trends and negative red flags to help you make better decisions for your brand and business.
Executive Summary
With $5.31 billion in sales in 2022, the California cannabis market is the largest in the world. It’s bigger than all of Canada, and more than double the size of the next closest U.S. state market (likely Michigan by this point.) It can be chaotic, and poor legislation means the black market still thrives. That’s likely part of the reason why the market has actually contracted YoY from 2021, ($5.78 billion) to 2022, ($5.31 billion). Can you guess which category has not contracted? While the entire market was down 4% vs P3M, pre-rolls gained 2% during that same time period; it’s that steady growth we have come to expect from the pre-roll category. [1][2][3]
California has a longer history and larger scale of cannabis production and distribution than all other states. As such, it sees trends develop earlier than most other markets, making it important to watch regardless of where you currently operate. The movements we see in this report aren’t surprising, but what will turn heads is the degree to which they have evolved. In fact, in this market they are no longer trends, just the “new normal” of consumer pre-roll preferences and tastes.

Revenue:
$222.5 million
(+2%)
Standard pre-roll sales:
$89.87 million
(-.8%)
Infused pre-roll sales:
$132.59 million
(+.8%)
Total brands:
281
(-24)
Total products:
5,929
(-264)

Jeeter
Stiiizy
Presidential Rx
West Coast Cure
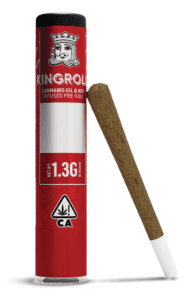
Kingpen
Raw Garden


40’s – Blue Dream – Infused .5g 5-pack

40’s – Strawberry Cough – Infused .5g 5-pack

40’s – Pink Acai – Infused .5g 5-pack

Sativa Strain Blends .35g 10-pack

40’s – Pineapple Express – Infused .5g 5-pack
image: courtesy stiiizy.com
Who’s Smoking
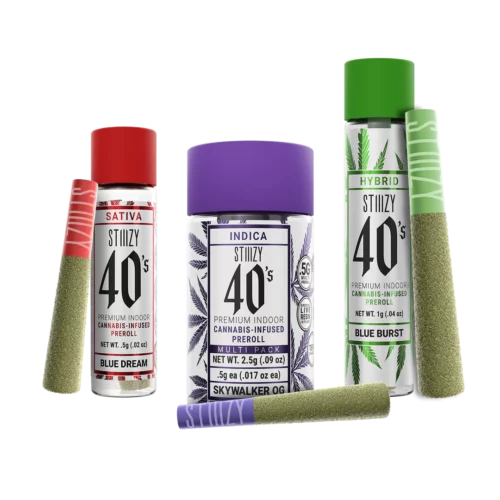
Stiiizy
Kingpen
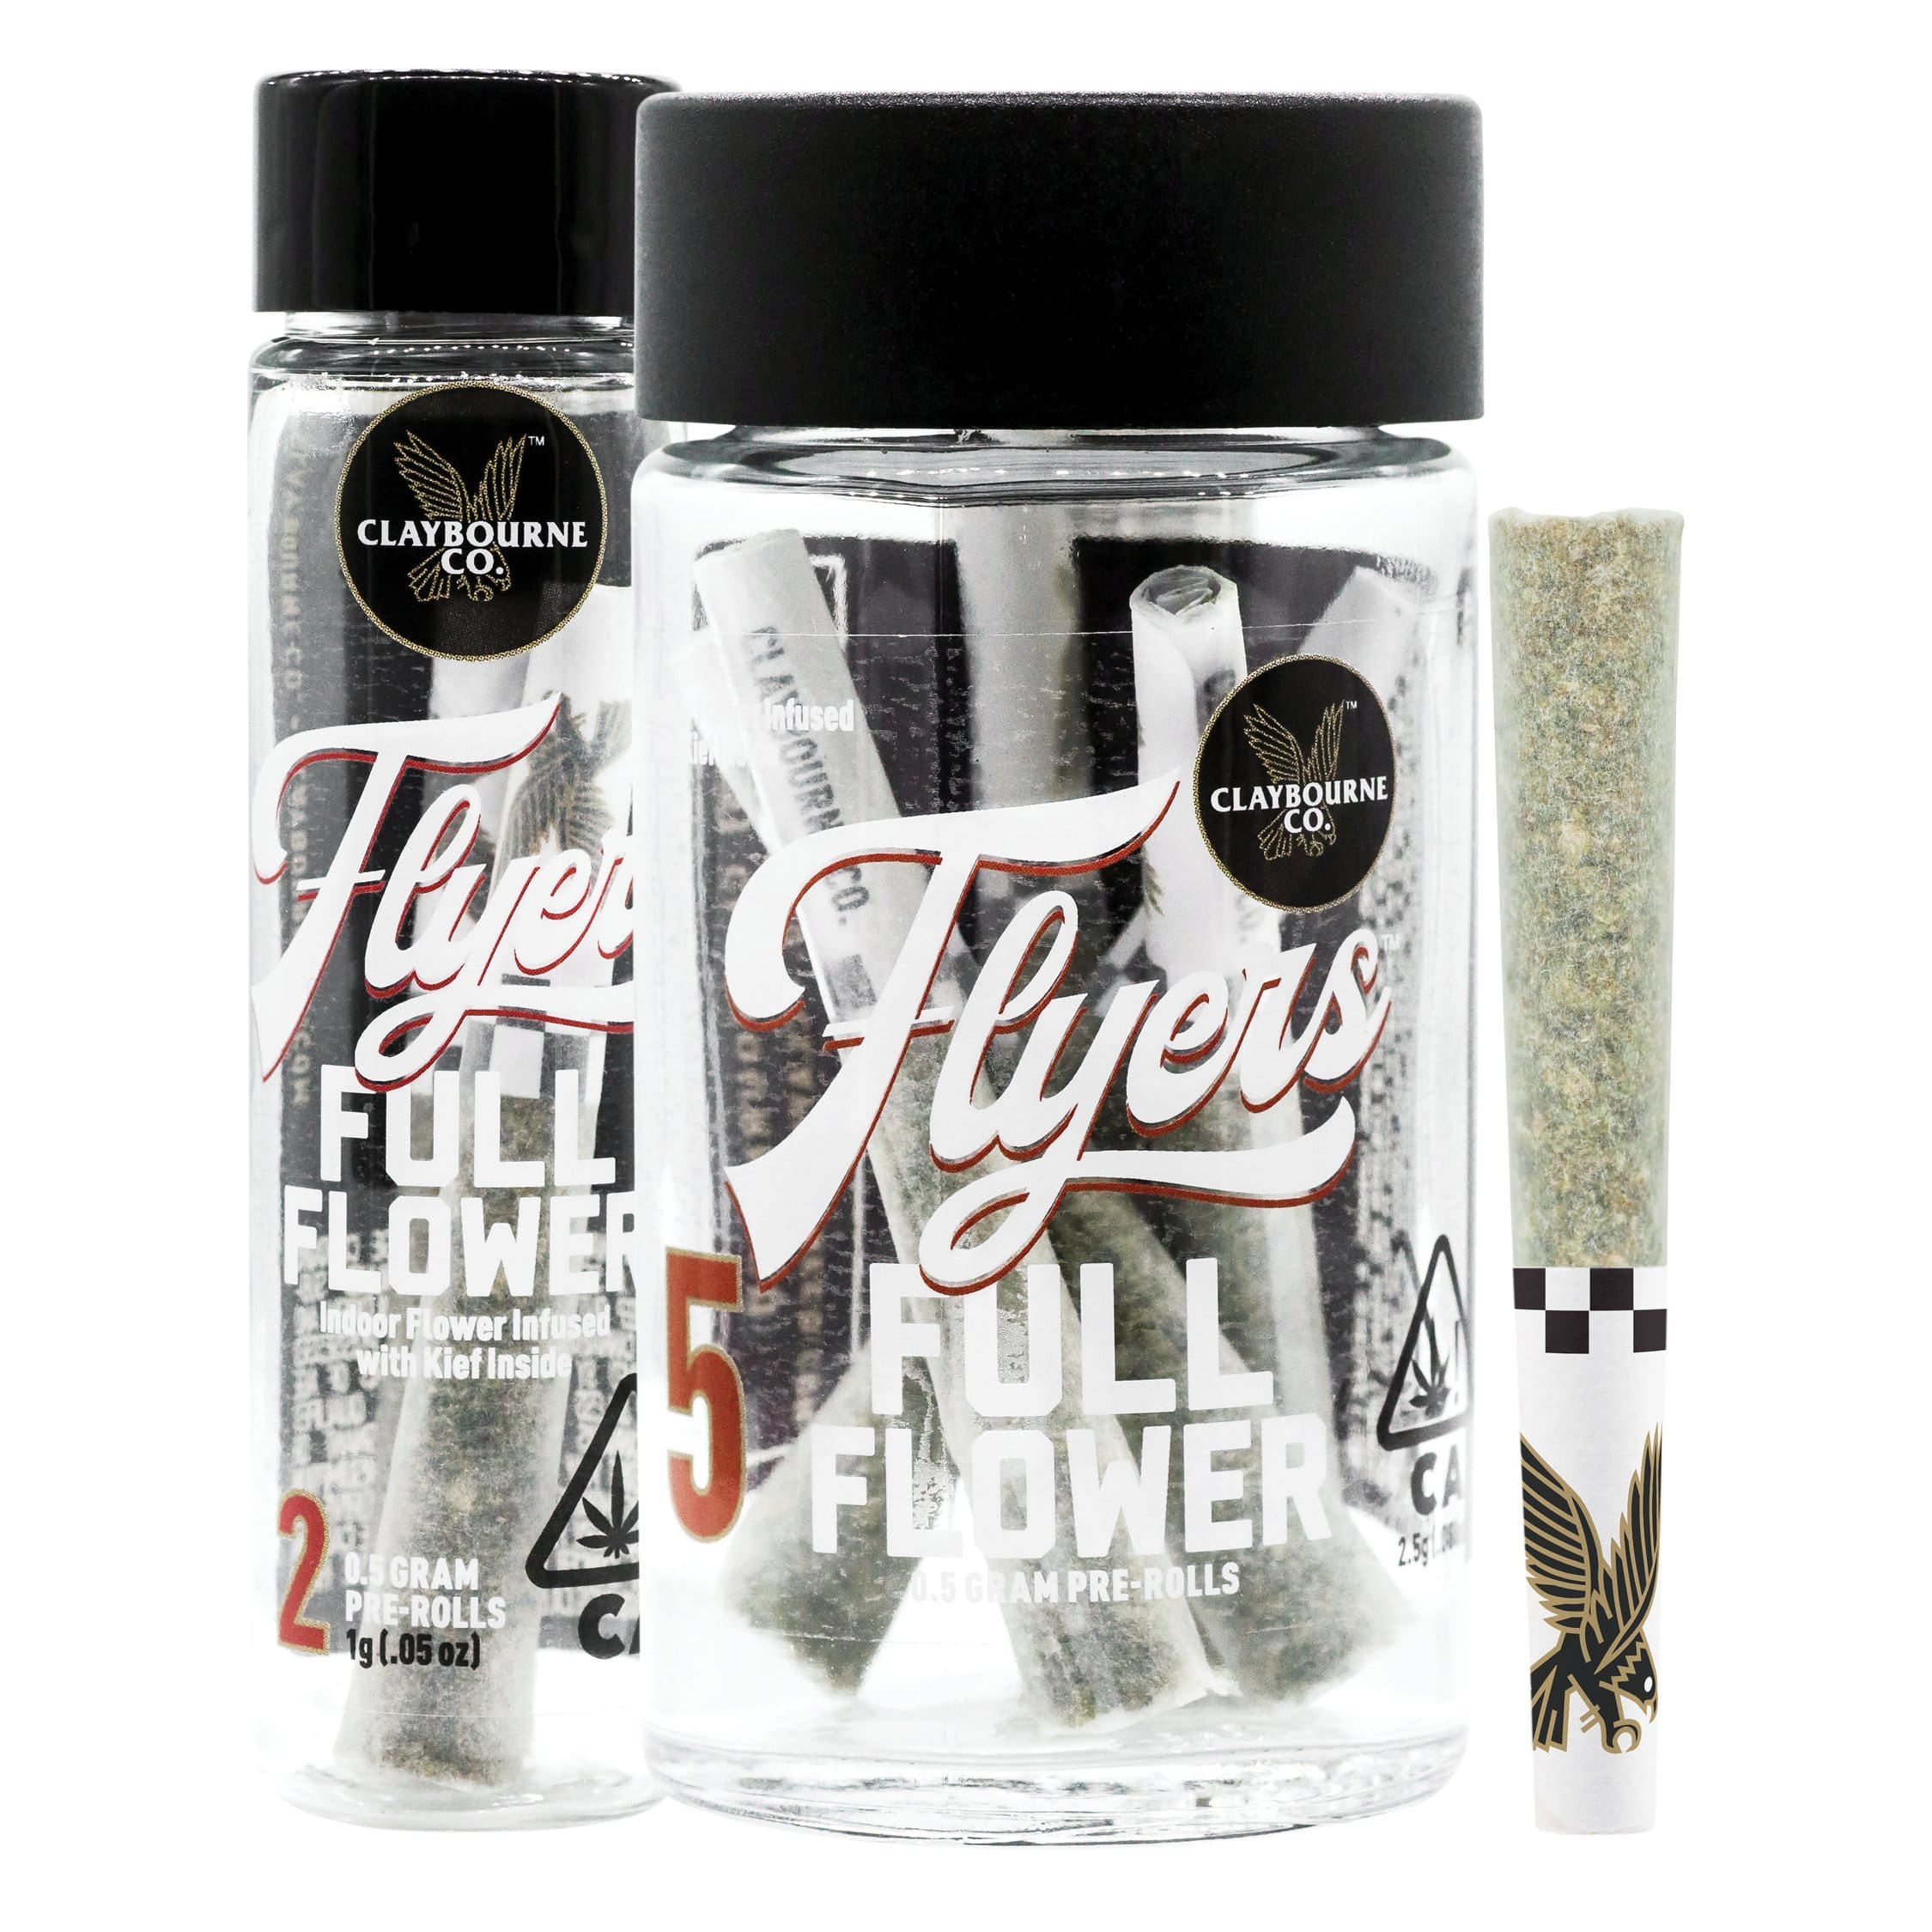
Claybourne Co
Who’s Sloping
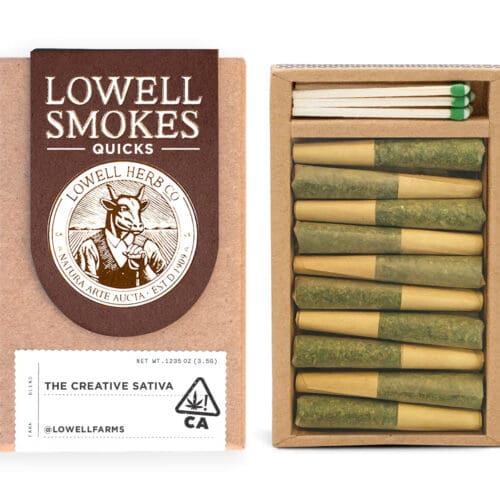
Lowell Herb Company
lowellfarms.com
Lolo (NorCal Cannabis)
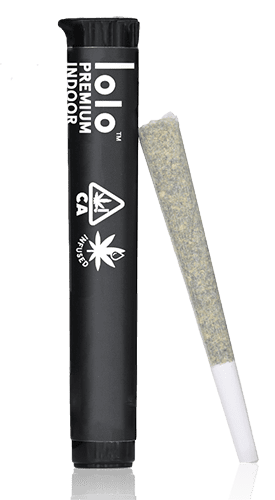
image: courtesy Urbn Leaf
Brand and product consolidation
Even though the category is still going up (despite the overall Cali market going down) the number of brands and SKUs are decreasing. There are a surprisingly low 281 brands operating in California. To help illustrate this point we’ve come up with an exciting new measurement for you! Pre-roll brands per capita*. California, however, has only .000007 pre-roll brands per capita. (As a comparison, both Massachusetts and Michigan have .000019 pre-roll brands per capita.) That’s significantly lower than all other states we’ve analyzed, and they’ve actually lost 24 brands vs P3M. Why? Most likely the difficult operating environment contributes, but beyond that we are just guessing. Products are consolidating too, with the market losing 264 SKUs vs P3M (5,929 total products as of Q3.) The average number of SKUs per brand is quite high at 21, compared to 16.5 in Oregon and 18 in Michigan. With the number of brands contracting faster than the number of SKUs (8.4% vs 4.5%) that number will likely rise. Interesting…
(* Yes, pre-roll brands per cannabis consumer would be a better measurement, but finding accurate and believable data on the total number of cannabis consumers in a market is difficult.)
Rise of the infused multipacks
60% of the pre-roll revenue in California is from infused pre-rolls. 60%! That is far higher than the next closest market we’ve analyzed, which is Michigan at 40%. Infused pre-rolls are now the primary pre-roll category, with non-infused pre-rolls playing second fiddle. The balance between the two seems to be stabilizing, with infused picking up only .8% share vs P3M. But that’s only half the story. Also notable is the popularity of multipacks. But not just any ol’ multipack… infused multipacks. In other markets we’ve analyzed, infused multipacks are starting to show strong performance, but aren’t common quite yet. California is the opposite. Every product but one in the top 20 is a multipack, and 18 of the top 20 are infused. Both non-infused products on the list are 10-packs; the only two 10-packs on the leaderboard, (5-packs dominate, accounting for 16/20 products on the board.) Our advice? Maybe 5 is just the right amount for consumers looking for convenience. But we’ll be surprised if an infused 10-pack doesn’t appear on the top 20 board soon.
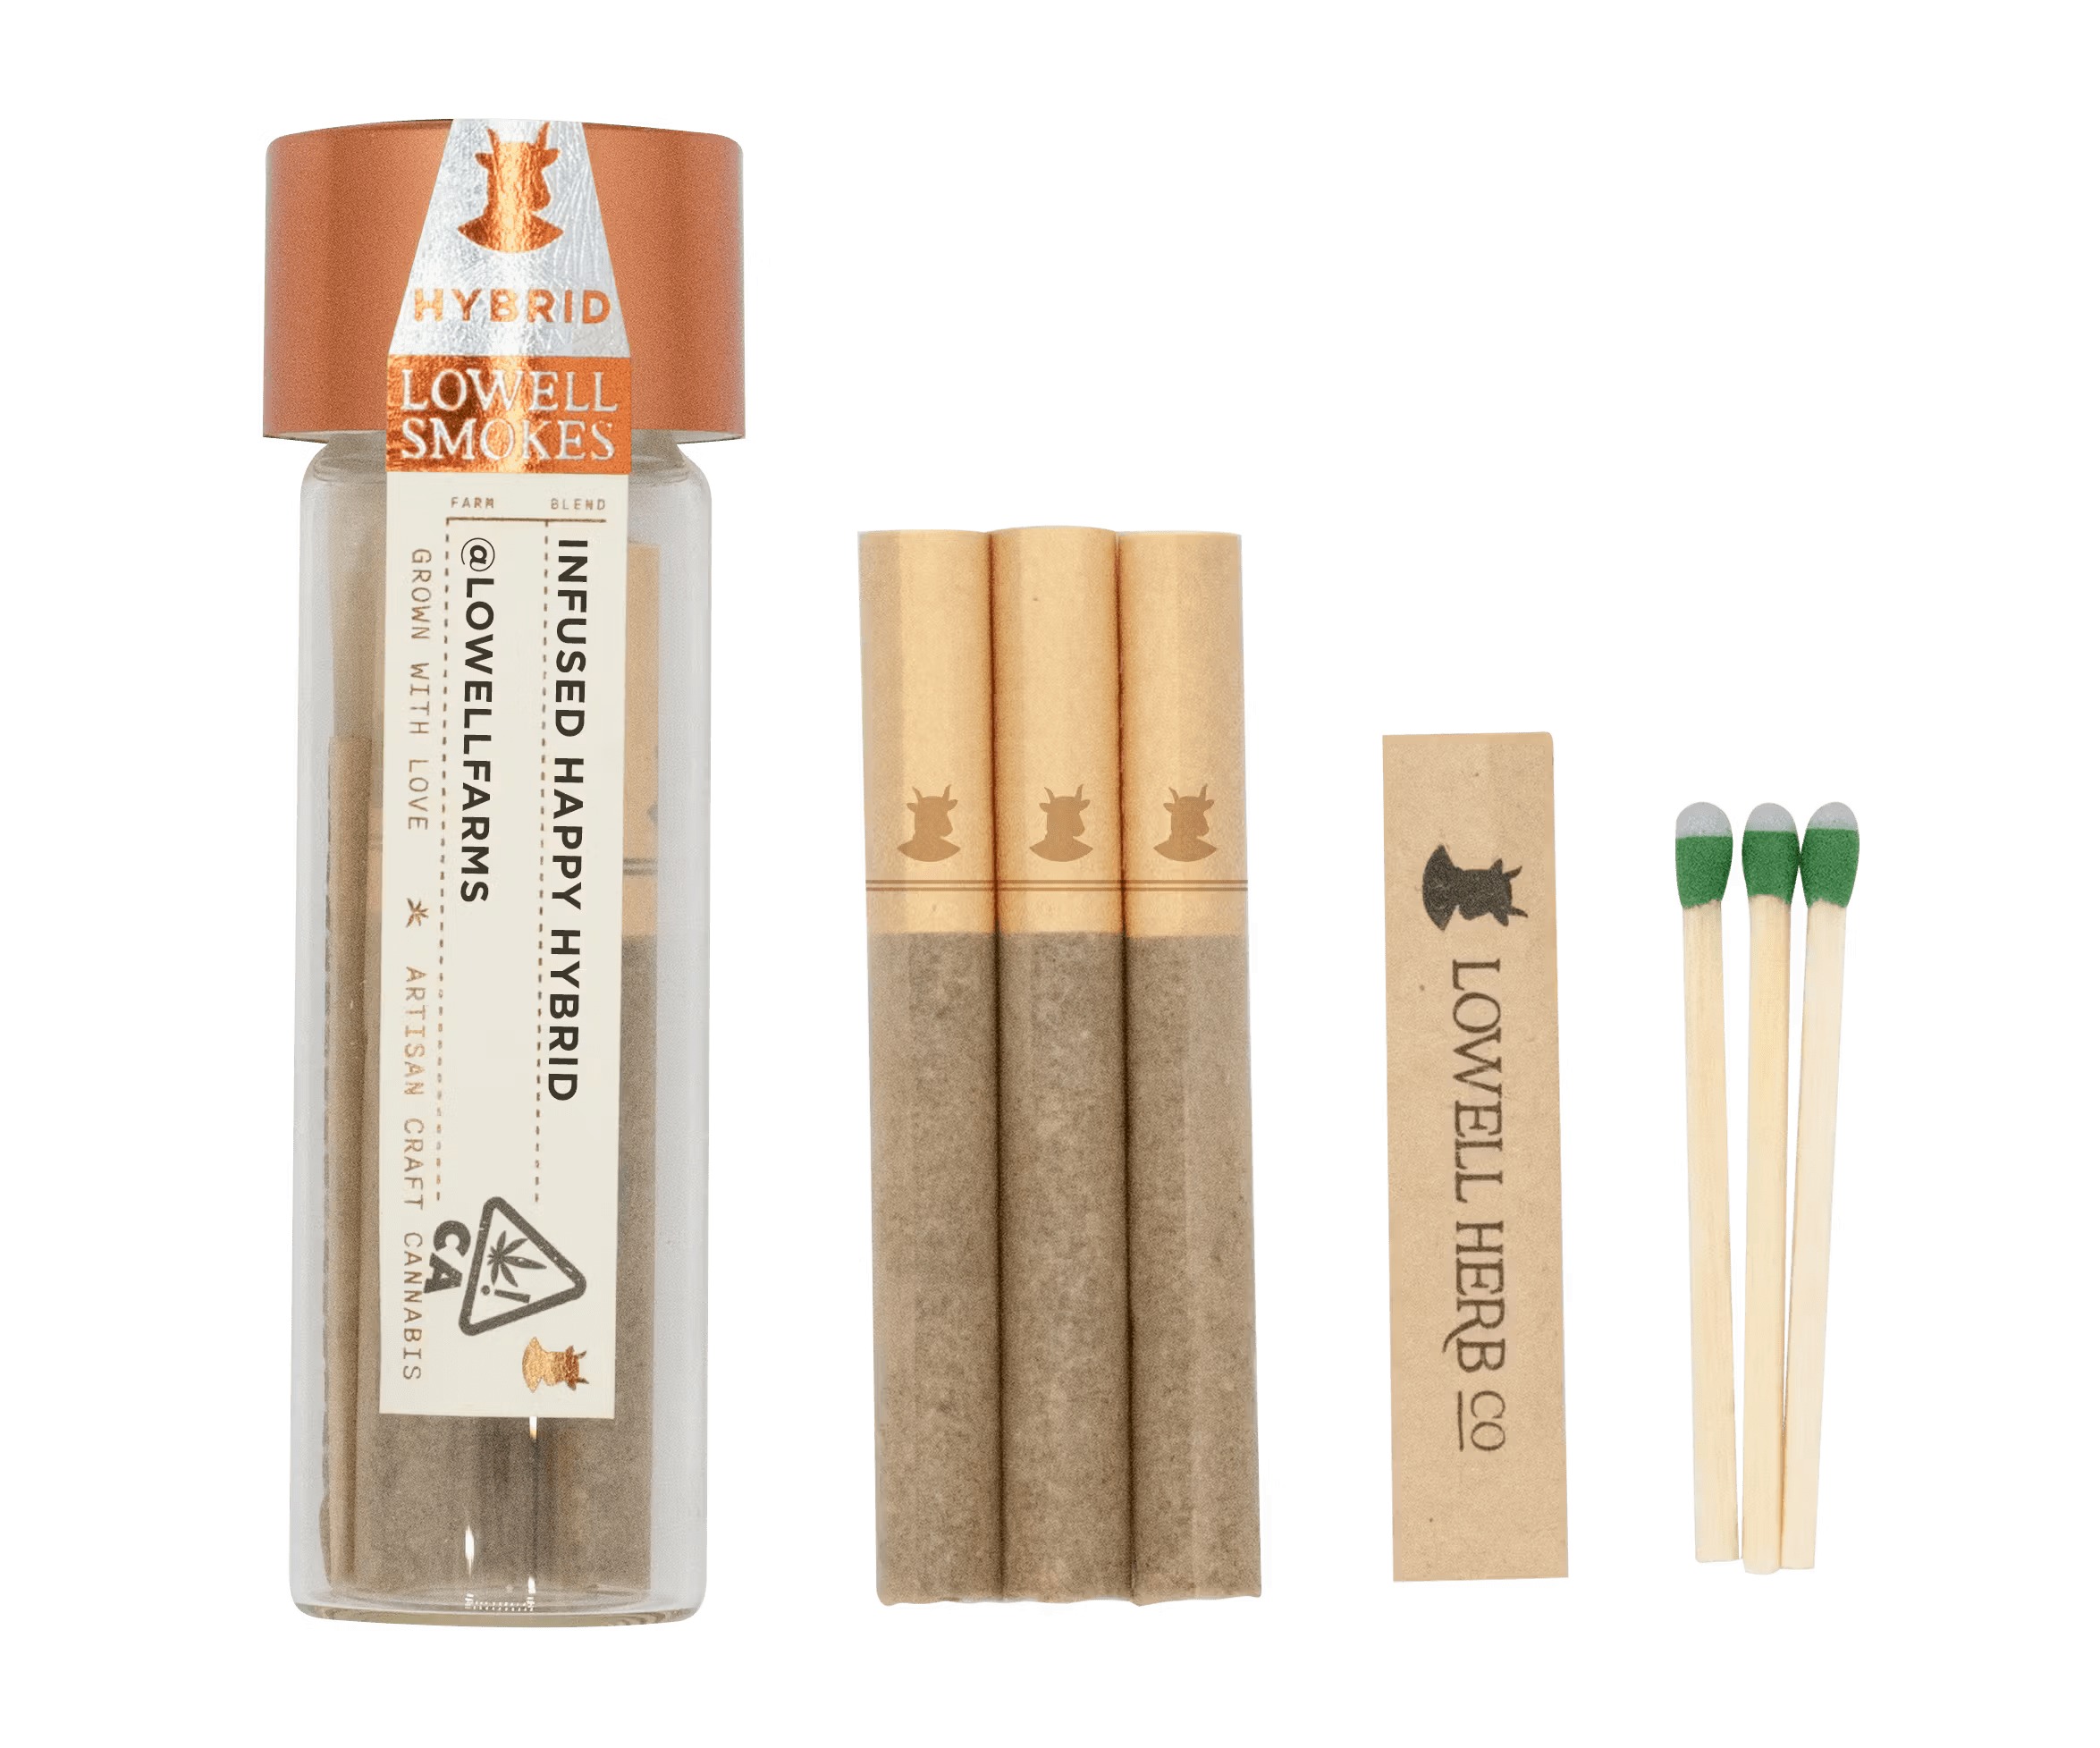
Image courtesy Lowell Farms – lowellfarms.com
Can Stiiizy go from
Challenger to Top Joint?
Image courtesy Jeeter
jeeter.com
To say Stiiizy is a challenger brand isn’t quite accurate, as their 8% share would absolutely dominate any other market besides California. In fact, the only other market we’ve analyzed where any one brand holds more than a 6% share is Missouri, with Clovr taking 17% of the category. But that’s an outlier and comes with an asterisk because the MO rec market is so new. And, in California, Jeeter still holds a large lead over Stiiizy as the market leader with 14% share of the category.
However, Stiiizy is clearly not messing around and are posting seriously impressive growth. They went from 6.8% to 8% of the market in just a single quarter. Not only that, they hold a whopping 9 products in the top 20… nearly HALF the products on the board are Stiizy! All but one of those 9 products is seeing positive growth vs P3M, with most of them posting double digit growth.
With both Jeeter and Stiiizy targeting the same segment (budget-minded frequent consumers), price may be playing a role here. Looking again at the top 20, Jeeter’s products average $12.57 per gram, while Stiiizy’s products are $11.52 per gram. But considering that all the products on the top 20 list for both brands are multipacks, that does equate to between $2-3 dollars difference per pack, depending on the size.
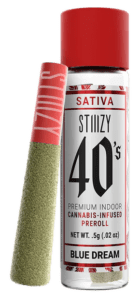
Image courtesy Stiiizy
stiiizy.com
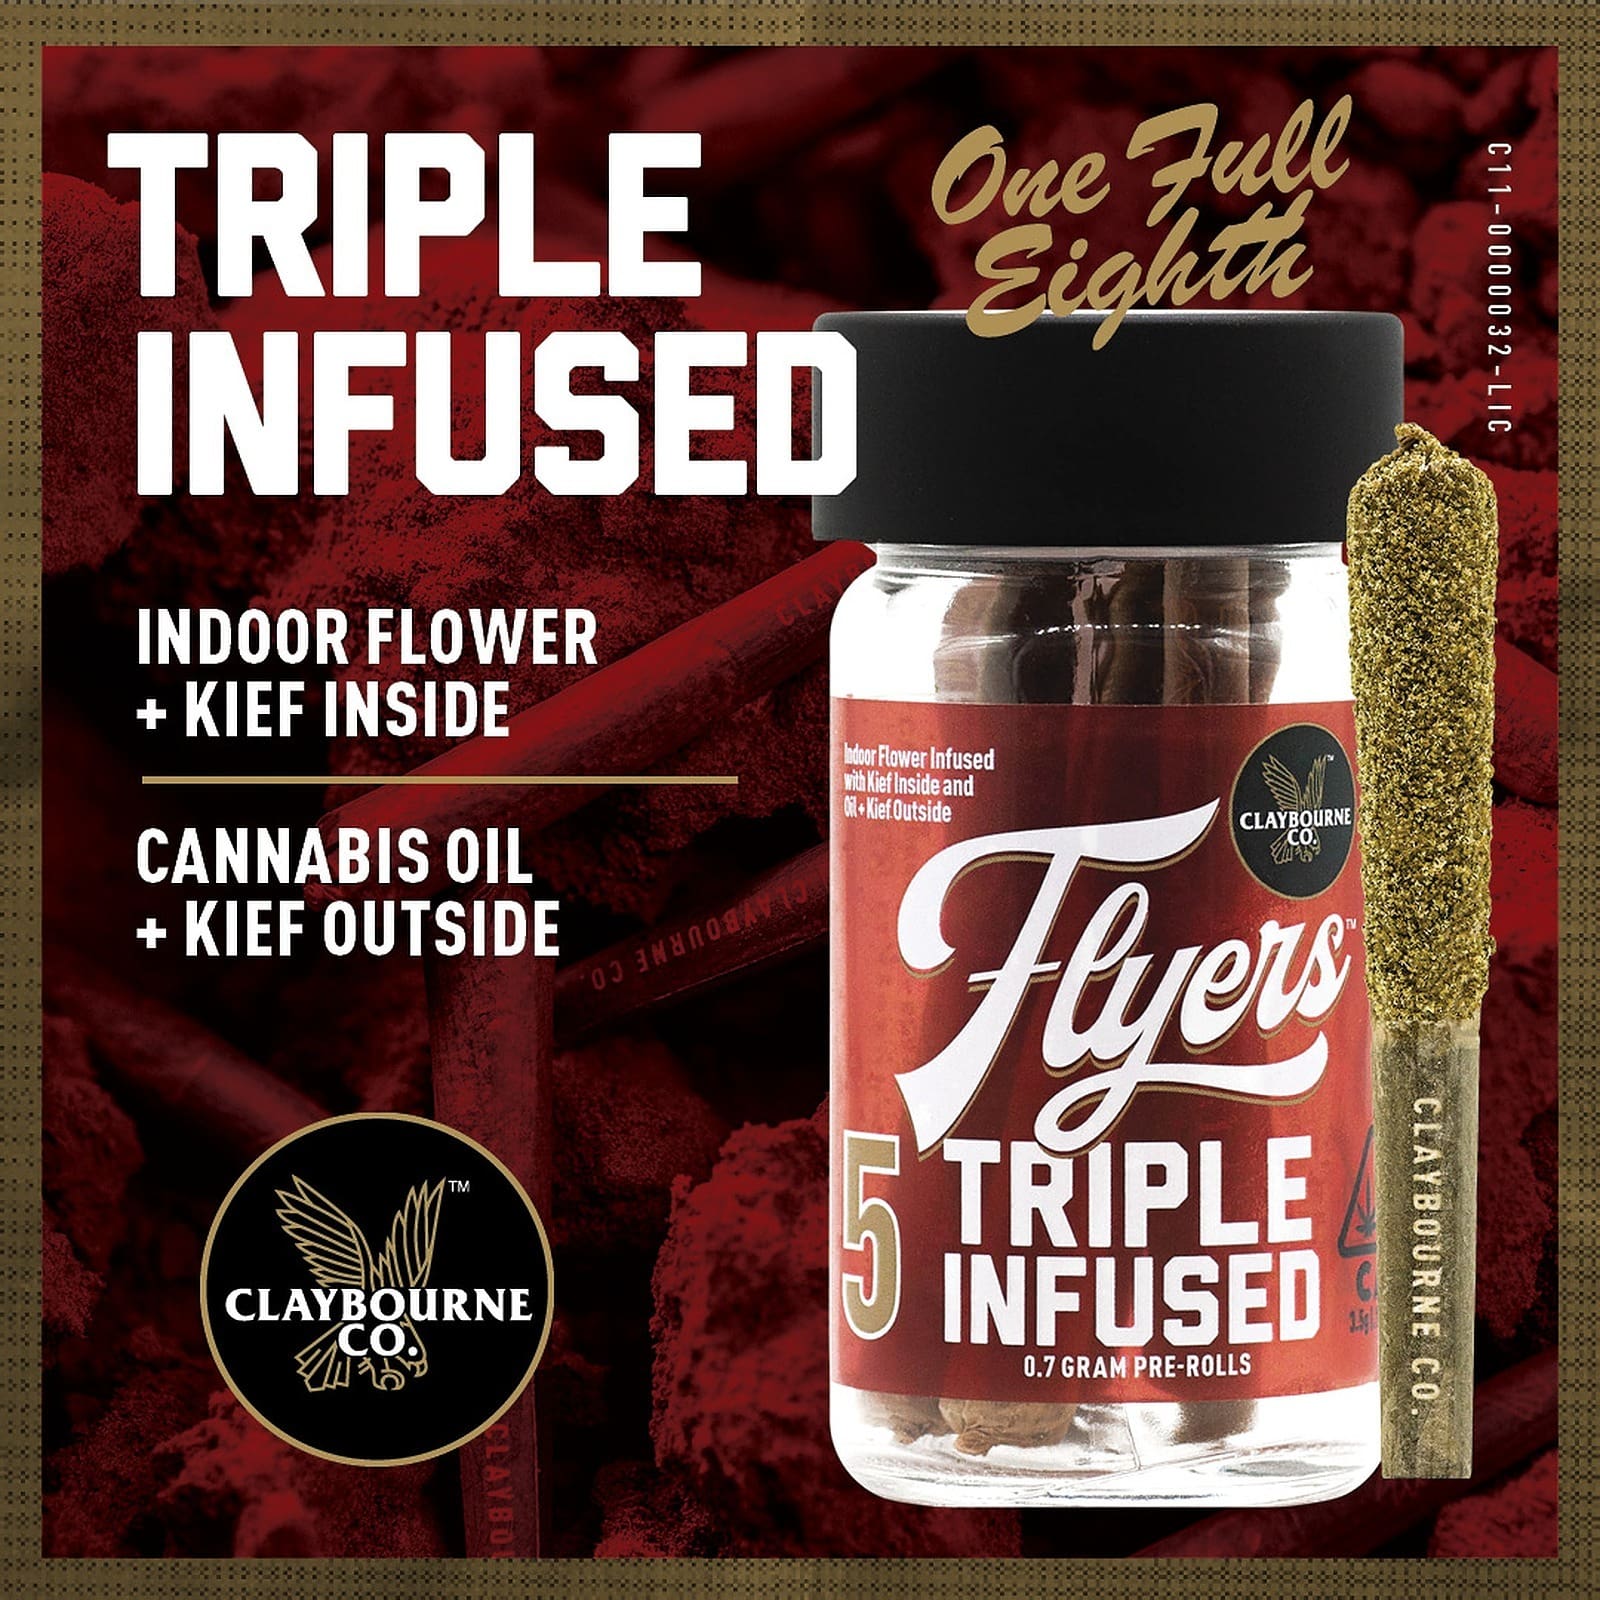
Image courtesy Claybourne Co.- claybourneco.com
Reluctant pre-roll consumers
Of all inhalable users, 43% smoked a pre-roll within the last 6 months. However, only 12% of users preferred pre-rolls (within the larger inhalables category). Cannabis users are begrudgingly choosing pre-rolls, likely for convenience; not because they prefer pre-rolls. That does appear to be changing. The 12% that prefer pre-rolls represent a 1.9 point bump vs P3M. If that trajectory continues, pre-rolls will likely have a larger preference share than both pipes and bongs within the next six months. What’s driving this trend? We believe it’s linked to what’s driving pre-roll growth overall: high-quality, infused joints. There is a much easier path for brands to create unique, value-added products with infused pre-rolls compared to non-infused. And with better and more consistent manufacturing methods now widely in use throughout North America, (including our own Blackbird system), a high-quality pre-roll is now a more scalable option.
Summary
California is the first market we’ve covered that has fully realized the trends we see in most other markets. Infused joints and multipacks both dominate the board, with the combination of both, (multipacks of infused joints), occupying 18 spots on the top 20 products leaderboard. Standard joints are now less common than infused and certainly less popular. Although with infused only growing by .8% vs P3M, the balance between infused and non-infused joints may have found equilibrium around the current 60/40 split. Despite its size, the California market has been labeled a disaster by just about everyone involved, especially growers and brands. Regardless, it is still the largest cannabis market in the world by a wide margin, and that extends to pre-rolls. Within the next 3-4 years we anticipate the pre-roll category alone will reach $1 billion in revenue, (annually). It’s such a large sample size that California represents a true harbinger of tastes, preferences, and trending products. Don’t ignore these numbers, regardless of your home market!
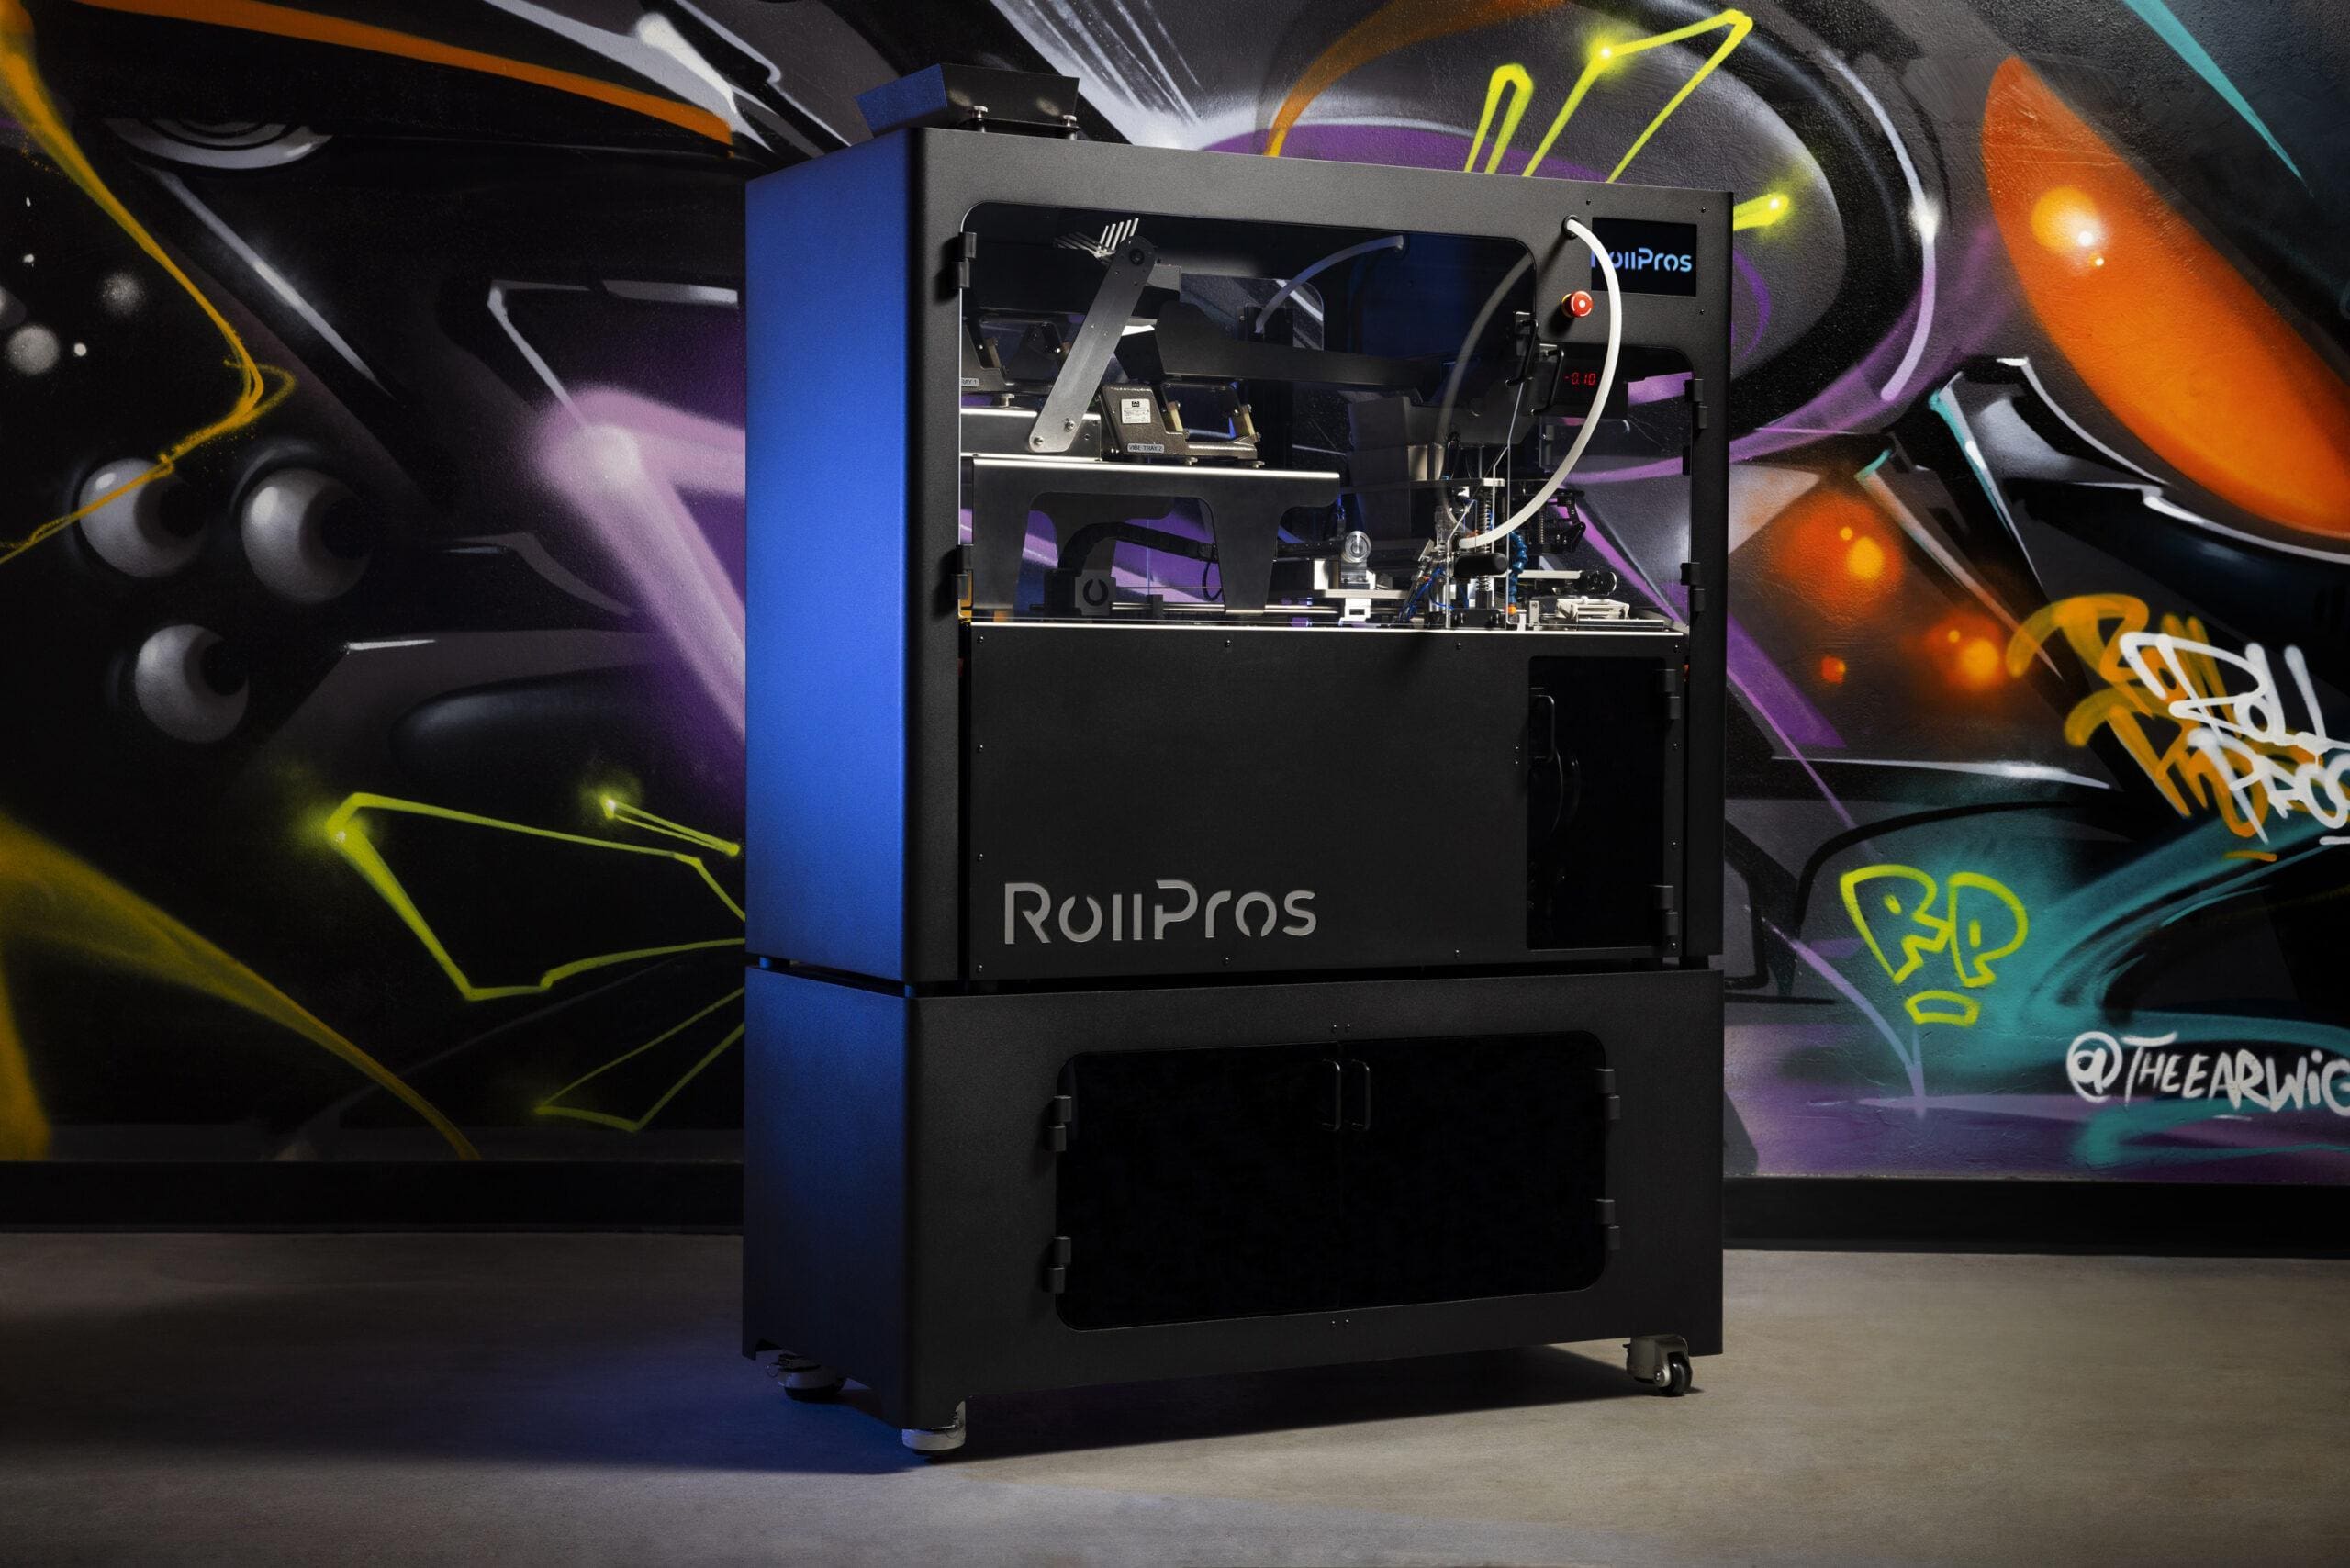
RollPros is the manufacturer of the Blackbird, the only automated joint machine that makes joints the same way you do: rolled, not stuffed. Brands across the US and Canada use the Blackbird to create unique, value-added products that 4/5 of consumers prefer over pre-rolls made with cones. RollPros is dedicated to helping customers build successful, profitable brands through continuous innovation, exceptional customer support, and category expertise.
Want to learn more? Reach out to one of our Pros now.
Download PDF
Grab a printable copy of this report by filling out the form below:


